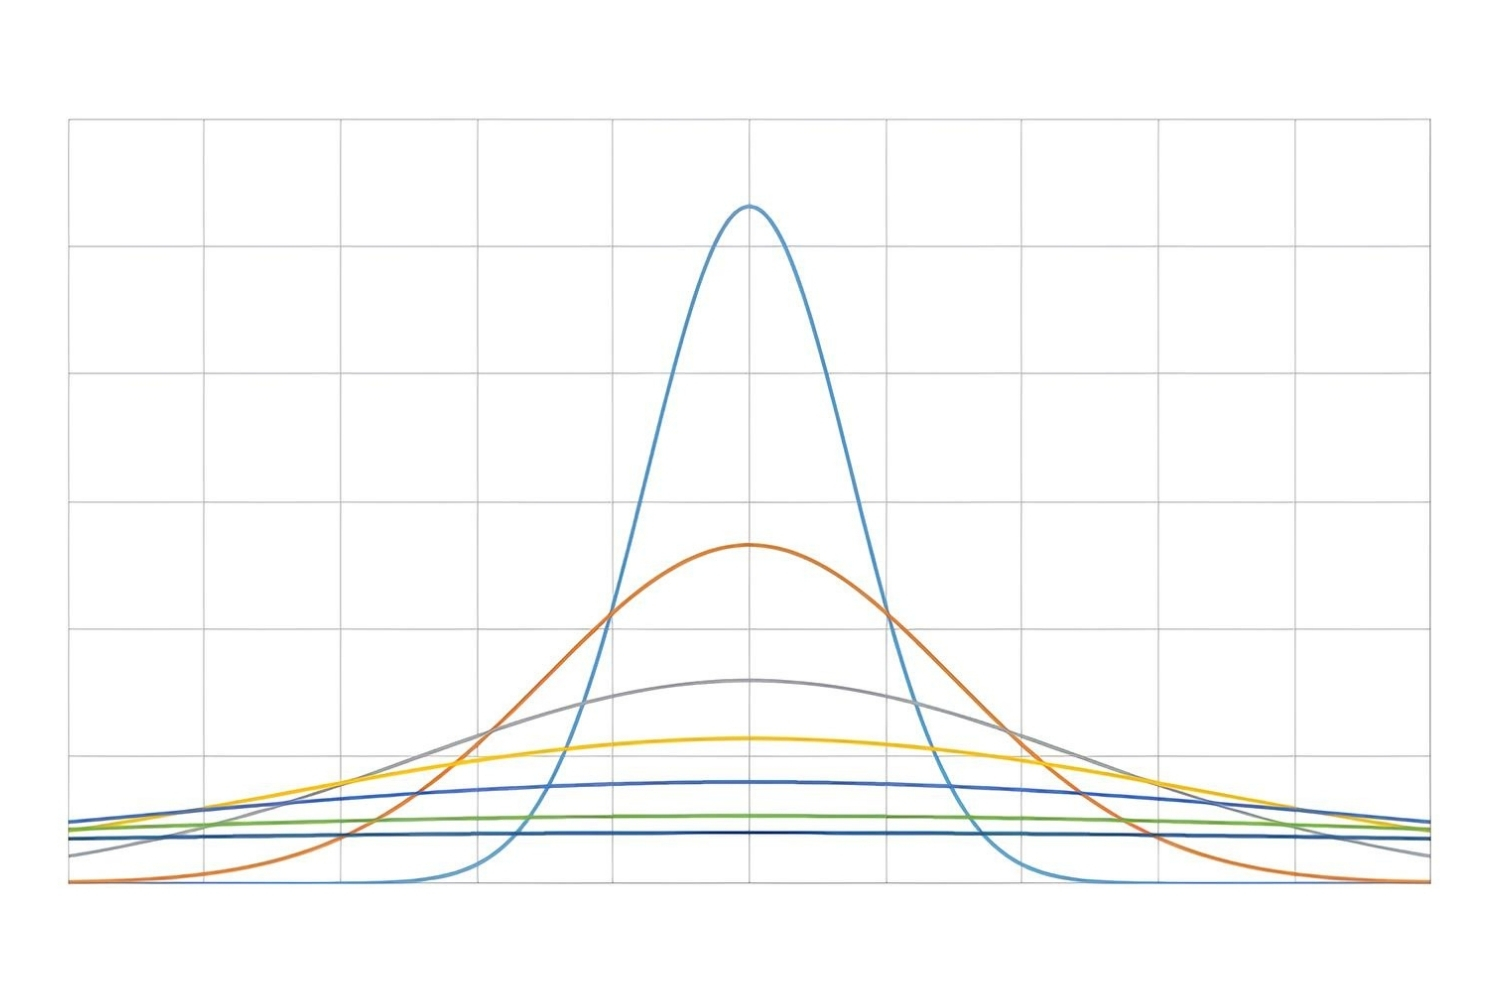
Understanding measures of variation is crucial for interpreting data accurately. This quiz will guide you through key concepts such as range, variance, and standard deviation, ensuring you grasp the importance of these statistical tools in analyzing data sets. Ready to test your knowledge and enhance your statistical skills? Let’s get started!
We recommend that you do not leave the page that you are taking this quiz in. Stay honest 🙂
Measures of Variation Quiz Questions Overview
1. What is the range in a data set?
The difference between the highest and lowest values
The average of all values
The middle value when data is ordered
The most frequently occurring value
2. Which measure of variation is most affected by extreme values?
Range
Interquartile Range
Variance
Standard Deviation
3. What does a small standard deviation indicate about a data set?
Data points are close to the mean
Data points are far from the mean
Data points are evenly spread out
Data points are skewed
4. How is the variance of a data set calculated?
By averaging the squared differences from the mean
By averaging the absolute differences from the mean
By finding the difference between the highest and lowest values
By finding the middle value of the data set
5. What is the interquartile range (IQR)?
The difference between the first and third quartiles
The difference between the highest and lowest values
The average of all values
The middle value when data is ordered
6. Why is standard deviation preferred over variance in some cases?
It is easier to interpret because it is in the same units as the data
It is always smaller than the variance
It is less affected by outliers
It is a more accurate measure of central tendency
7. What does a high variance indicate about a data set?
Data points are widely spread out from the mean
Data points are close to the mean
Data points are evenly spread out
Data points are skewed
8. Which measure of variation is used to describe the spread of the middle 50% of a data set?
Interquartile Range (IQR)
Range
Standard Deviation
Variance
9. What is the purpose of using measures of variation?
To describe the spread or dispersion of data points
To find the central value of the data set
To identify the most frequent value
To determine the overall trend of the data
10. Which measure of variation is not affected by extreme values?
Interquartile Range (IQR)
Range
Variance
Standard Deviation
11. How is the standard deviation related to the variance?
Standard deviation is the square root of the variance
Standard deviation is the square of the variance
Standard deviation is twice the variance
Standard deviation is half the variance
12. Which measure of variation would you use to describe the consistency of a data set?
Standard Deviation
Range
Interquartile Range (IQR)
Mode
13. What does a standard deviation of zero indicate?
All data points are identical
Data points are widely spread out
Data points are evenly distributed
Data points are skewed
14. Which of the following is a measure of central tendency?
Mean
Range
Variance
Standard Deviation
15. How do outliers affect the standard deviation?
They increase the standard deviation
They decrease the standard deviation
They have no effect on the standard deviation
They make the standard deviation zero
16. Why is the interquartile range (IQR) considered a robust measure of variation?
It is not affected by extreme values
It uses all data points
It is easy to calculate
It is always smaller than the range
17. What is the primary difference between the range and the interquartile range (IQR)?
Range considers all data points, while IQR considers only the middle 50%
Range considers only the middle 50%, while IQR considers all data points
Range is always larger than IQR
Range is always smaller than IQR
We recommend that you do not leave the page that you are taking this quiz in. Stay honest 🙂


